Thought Leadership Blog

The influence of ORP on the bioremediation of contaminants in the subsurface
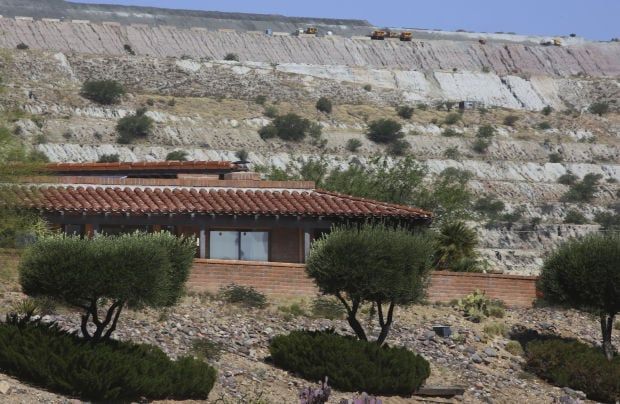
Abstract The mining industry, especially in Africa, faces significant environmental challenges, notably the rehabilitation of mine slopes and tailings storage facilities (TSFs). Traditional stabilization methods often fall short in sustainability and environmental protection. Biogeotechnics, integrating geotechnical engineering with biological processes, presents a promising sustainable alternative. This review explores biogeotechnical strategies, focusing on vegetation use, microbial processes, and their combined applications in mine rehabilitation. It highlights the advantages of biogeotechnics over conventional methods, discusses the implementation challenges, and identifies research gaps. This paper aims to provide a comprehensive overview of current knowledge and future directions in the biogeotechnical rehabilitation of mine-affected areas in Africa. 1. Introduction Mining activities significantly contribute to the African economy but also pose substantial environmental risks, particularly concerning mine slope stability and the management of TSFs. Traditional methods for addressing these risks, such as physical barriers or chemical treatments, are often environmentally damaging and unsustainable in the long term (Blight, 2010; Suter et al., 2019). Biogeotechnics offers a sustainable alternative, leveraging biological processes for soil stabilization and environmental restoration (DeJong et al., 2013). This review examines the principles, applications, benefits, and challenges of biogeotechnics in the African mining context. 2. Environmental Challenges of Mine Slopes and TSFs Mine slopes and TSFs are critical components of mining operations, with their failure posing risks to human safety, environmental health, and economic stability. The collapse of these structures can lead to soil erosion, water contamination, and loss of biodiversity (Blight, 2010). Traditional stabilization techniques often rely on costly engineering solutions that may not offer long-term sustainability or environmental protection. 3. Biogeotechnical Rehabilitation Strategies Biogeotechnics combines geotechnical engineering with biological processes to address environmental challenges in mining. Key strategies include: Phytoremediation: Utilizing plants to absorb and detoxify pollutants from soil and water (Gerhardt et al., 2017). Biocementation: Employing microorganisms, such as Sporosarcina pasteurii, to induce mineral precipitation, strengthening soil structure (Chu et al., 2012; DeJong et al., 2011). Rhizofiltration: Leveraging root systems to stabilize soil and control erosion (Gerhardt et al., 2017). These strategies not only stabilize mine slopes and TSFs but also contribute to the ecological restoration of mine-affected areas. 4. Advantages of Biogeotechnical Approaches Biogeotechnical methods offer several benefits over conventional stabilization techniques, including: Sustainability: Leveraging natural processes for rehabilitation, reducing reliance on non-renewable resources (Suter et al., 2019). Cost-effectiveness: Potentially lower long-term costs due to reduced maintenance and engineering needs (Smith and Brady, 2015). Environmental benefits: Enhancing biodiversity, improving water quality, and restoring ecological balance (Suter et al., 2019). 5. Implementing Biogeotechnical Solutions Successful implementation requires careful planning, selection of appropriate plant species and microorganisms, site preparation, and ongoing maintenance. Challenges include ensuring long-term viability, managing invasive species, and adapting to local climatic and soil conditions. Collaboration among engineers, biologists, and ecologists is crucial for developing effective biogeotechnical solutions. 6. Research Gaps and Future Directions Despite the promising prospects of biogeotechnics, several research gaps remain, including: Long-term effectiveness: More longitudinal studies are needed to assess the durability of biogeotechnical solutions under various environmental conditions (Harkes et al., 2010). Microbial impacts: Understanding the ecological implications of introducing specific microorganisms into new environments (DeJong et al., 2011). Scalability: Developing cost-effective, scalable biogeotechnical solutions for widespread application in the mining industry. 7. Conclusion Biogeotechnics represents a sustainable, cost-effective, and environmentally friendly approach to the rehabilitation of mine slopes and TSFs in Afr ica. By integrating geotechnical engineering with biological processes, this approach offers a promising alternative to traditional stabilization methods. However, further research is needed to address existing knowledge gaps and to optimize the scalability and effectiveness of biogeotechnical solutions. References Blight, G.E. (2010). Geotechnical Engineering for Mine Waste Storage Facilities. CRC Press. Chu, J., Stabnikov, V., & Ivanov, V. (2012). Microbially Induced Calcium Carbonate Precipitation on Surface or in the Bulk of Soil. Geomicrobiology Journal, 29(6), 544-549. DeJong, J.T., et al. (2011). Microbially Induced Cementation to Control Sand Response to Undrained Shear. Journal of Geotechnical and Geoenvironmental Engineering, 132(11), 1381-1392. DeJong, J.T., et al. (2013). Biogeochemical Processes and Geotechnical Applications: Progress, Opportunities, and Challenges. Geotechnique, 63(4), 287-301. Gerhardt, K.E., Gerwing, P.D., & Greenberg, B.M. (2017). Phytoremediation and rhizoremediation of organic soil contaminants: Potential and challenges. Plant Science, 256, 180-195. Harkes, M.P., et al. (2010). Fixation and distribution of bacterial activity in sand to induce carbonate precipitation for ground reinforcement. Ecological Engineering, 36(2), 112-117. Smith, J.A., & Brady, K.B.C. (2015). Biogeotechnical Engineering for Mine Waste Stabilization. Environmental Geotechnics, 2(EG1), 35-44. Suter, G.W., Tsao, C.L., & Yonavjak, L. (2019). Making Ecological Restoration More Effective: Integrating Ecological and Engineering Approaches. Restoration Ecology, 27(3), 540-545.
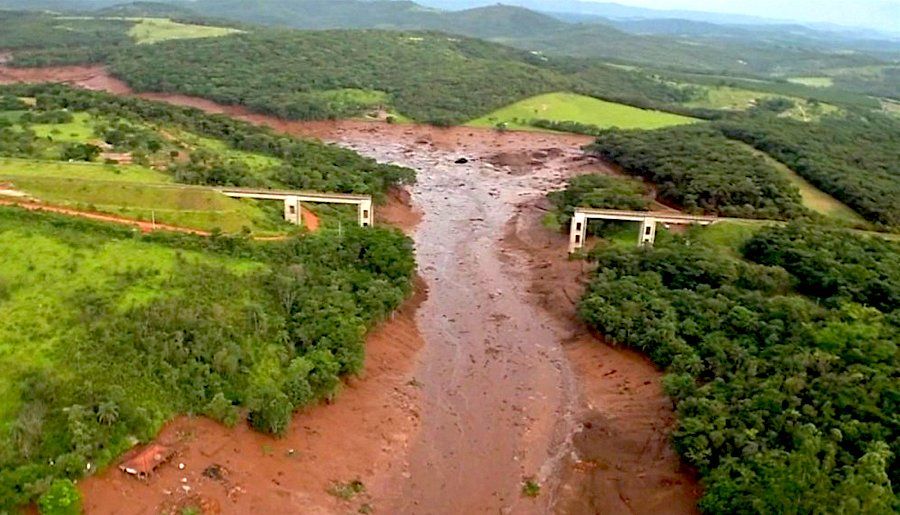
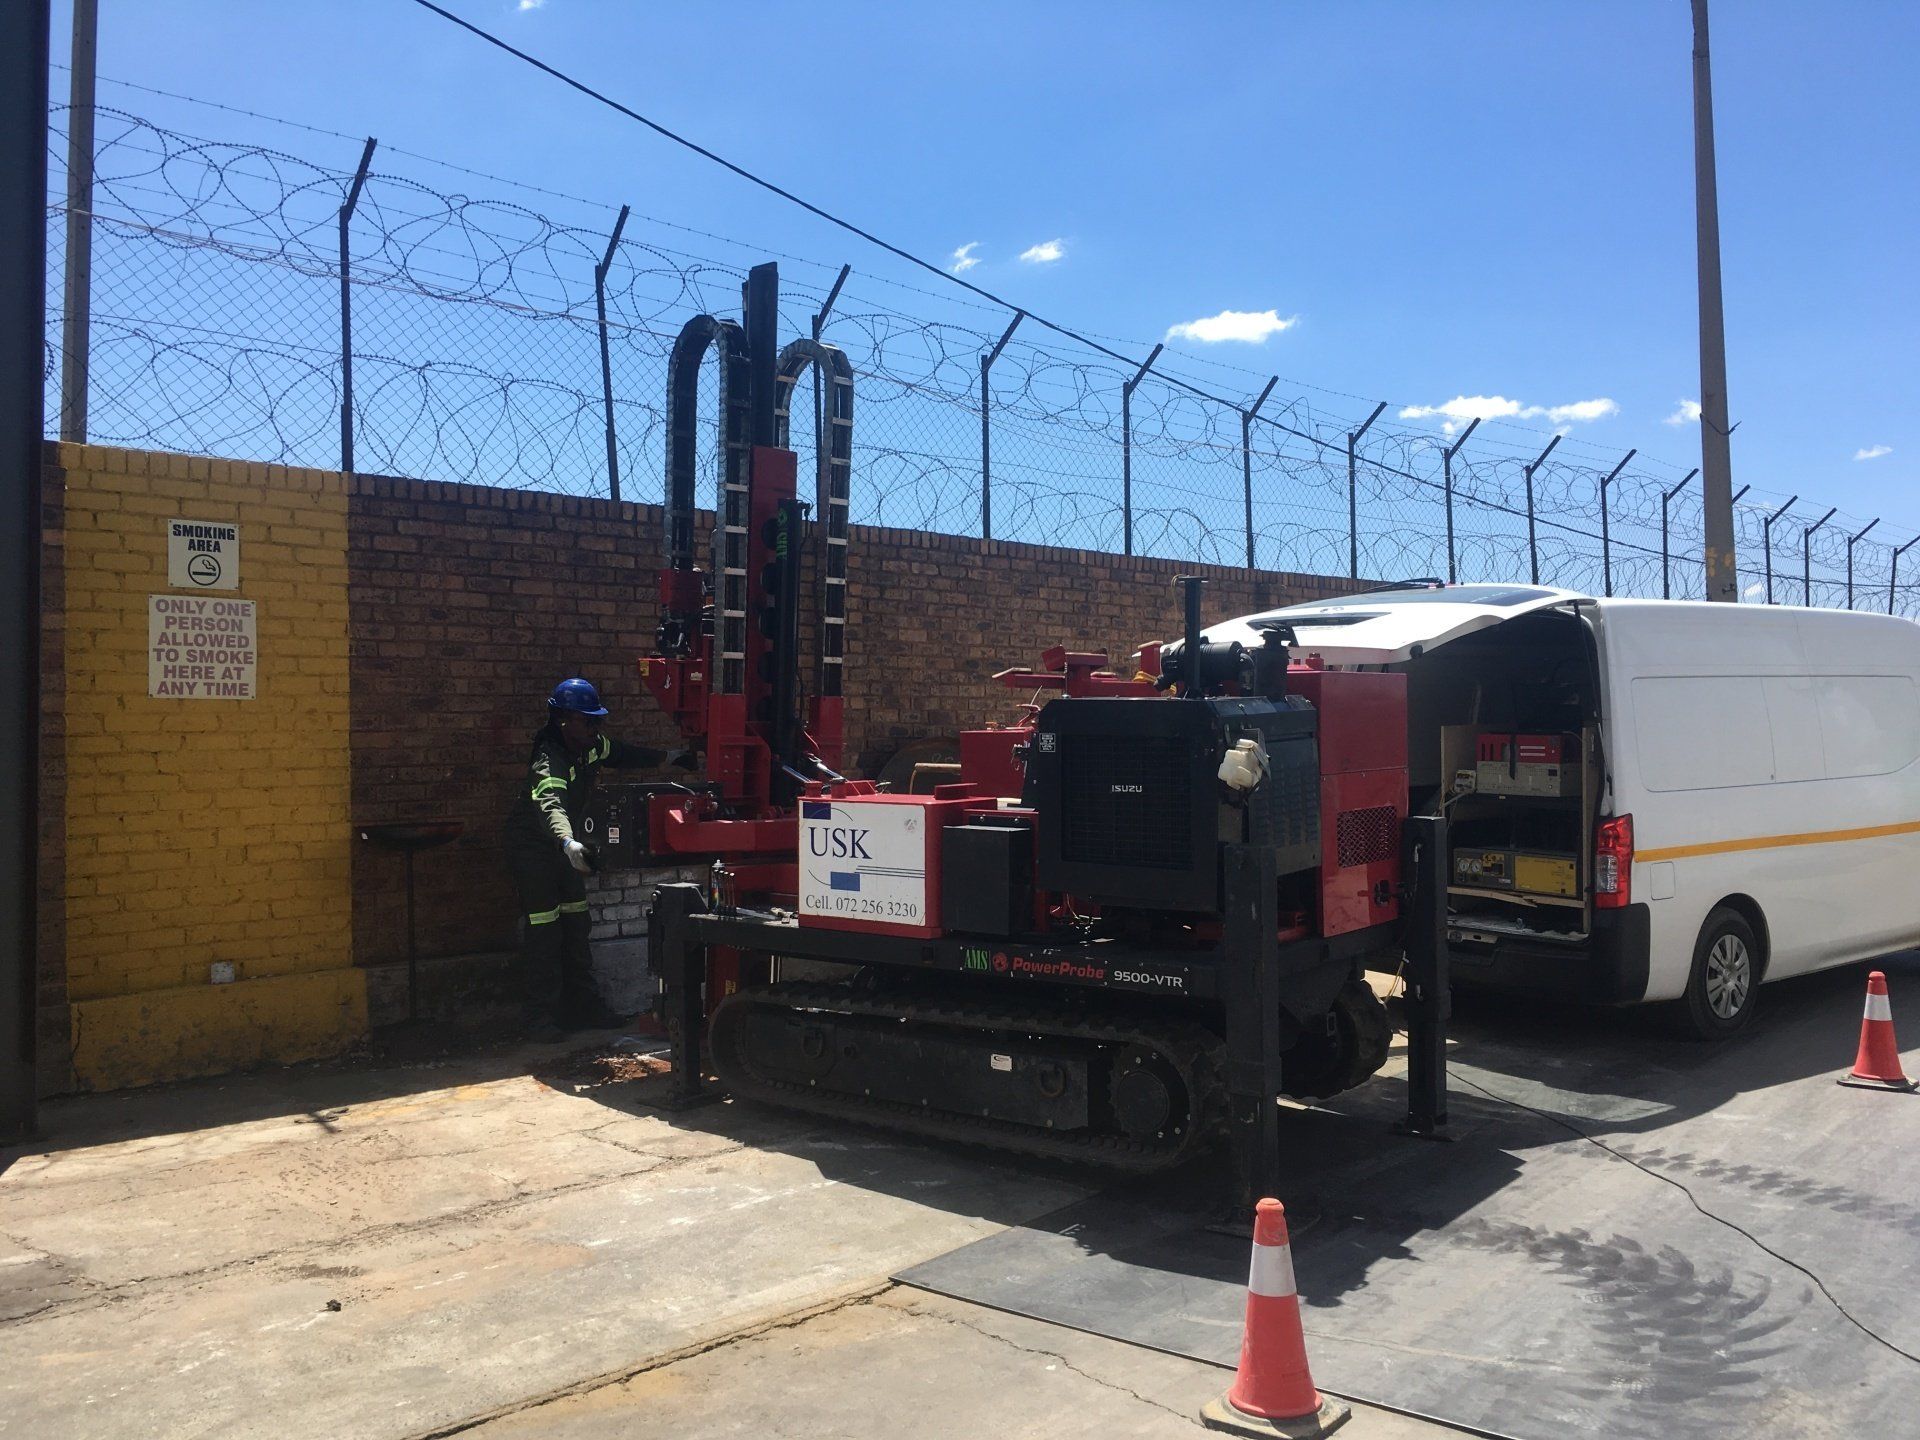
Introduction Following the recent Jagersfontein tailings failure the co-conveners of the Global Industry Standard on Tailings Management (GISTM): ICMM, PRI and UNEP, made the joint statement below: "The failure of a dam containing mine waste – or tailings – in Jagersfontein, in South Africa’s Free State province, on 11 September was a tragedy that underscores the critical importance of responsible tailings management. We mourn those who lost their lives in the incident. All stakeholders – from companies to governments and investors – must urgently work to enhance the safety of tailings storage facilities across the globe." This is beginning to sound like the "we strongly condemn" statements we are used to hearing from United Nations following some political disasters or human rights abuse but with little or no action at all. Nonetheless at USK we continue to push for use of advances in technology and science to provide solutions for better mine tailings investigations, design and mitigation against slope failure. The causes of mine tailings dam slope failure are different as each failure is always site-specific, although common themes always emerge around: Poor site investigation. Inappropriate engineering design. Lack of risk assessment especially consequence analysis. The slope stability of the walls of a tailings dam is one of the factors controlling the dam's operation. When a stability assessment indicates that the factor of safety against slope failure is too low, no more tailings should be deposited on that dam until the condition of the walls has improved. Slope stability is generally controlled by three factors: The geometry of the slope The strength parameters of the material comprising the slope, and The pore pressure regime in the slope In this article, we focus attention on pore pressure regime monitoring sometimes referred to as seepage regime monitoring. Pore pressure or Seepage monitoring in a tailings dam during its operational life is a critical and indispensable aspect in the continous monitoring and management of tailings dams. Failure in a slope, known as volume deformation, will present (under various pressures and stresses) as three possible scenario: Compression of water in the pores of the material Compression of individual particles (sediments etc) Re-arrangement of particles, usually to a more compact configuration. As described in Morton et al 2008, the stress state for any point in a slope is governed by the principal stresses and the acting water pressure (measured as pore pressure). The directions of stress acting on a hypothetical plane are indicated in the figure at the end of this article. Pore Pressure or Seepage Monitoring Standpipe Piezometers Currently in Africa it is common practice to use standpipe piezometers to monitor the pore water regime. A series of single standpipe piezometers along a section across the dam wall are generally used. The water level in the standpipe is assumed to represent the phreatic surface and it is then assumed that pore pressures increase hydrostatically with depth. This seepage regime is then used in the stability analysis of the tailings dam walls. The water levels in the piezometers are normally read once a month. It is then assumed that the water level in the piezometer corresponds with the position of the phreatic surface in the material surrounding the standpipe. It is further assumed that the pore pressures in the surrounding material increase hydrostatically with depth be-low the piezometer water level. These assumptions are based on the view that flow in a tailings dam is very slow owing to the low permeability of tailings, giving rise to approximately hydrostatic conditions. Standpipe piezometers have been found to have significant limitations and disadvantages: high carbon footprint due to monthly trips to take measurement. Susceptible to clogging /silting especially if construction was poorly done. Not representative and only provide an instantenous value. A word on installation method: We have also found that mine tailing operators tend to use the cheapest contractors who can punch a hole and stick a pipe in the ground without technical understanding of proper installation of standpipe piezometers. We get called out to reinstall many standpipes on site with clogged, blocked and dry standpipe piezometers. The correct practice is that following the installation of an open-standpipe piezometer, measurements should be taken to verify that the piezometer is functioning as expected, and the top should be protected against accidental damage or vandalism. The hydraulic response of open standpipe piezometers can be checked by: Bailing or evacuating water from within the piezometer riser pipe and letting groundwater re-enter through the sensing zone (rising-head test) Adding water to the piezometer riser pipe and letting water flow out from the piezometer sensing zone (falling-head test) Inserting a solid rod into the standpipe and forcing water flow out from the piezometer sensing zone. The correct method must be selected in accordance with ASTM D 4043, “Standard Guide for Selection of Aquifer Test Method in Determining Hydraulic Properties by Well Techniques,” should be followed for selection of suitable methods for checking the hydraulic response of standpipe piezometers. Cone Penetrometer Testing or Piezocone (CPTu) Cone Penetrometer testing (CPTu) sometimes called piezocone is an in situ testing device consisting of a probe that is forced into the ground at a constant rate (2cm/sec) by means of specialized drill rigs. The probe has the ability to measure the resistance to penetration at the tip of the probe, as well as the pore water pressures around the probe. The aim of the CPTu investigations on tailings dams was to accurately determine the pore pressure distribution in the dams, as well as to identify weak layers. With the actual pore pressure distribution available, more realistic slope stability assessments could be conducted to assess the safety of the dams. The pore pressure distribution measured using CPTu differed substantially from the traditionally assumed regime, ie a phreatic surface represented by the water level in the piezometer and a hydrostatic pore pressure increase with depth. This observation has far-reaching implications for the tailings dam industry in that the calculated factors of safety could be incorrect and not always conservative. While the use of CPT is gaining traction, it is currently only used as a once off technique in determine pore pressure and phreatic levels during design and guide installation of piezometers. However we suggest that due to the dynamic nature of pore pressure regime in tailings, mine operators should schedule CPT (at least 3 times a year) to reduce uncertainty in their tailings surveillance. Vibrating Wire Piezometers (VWP) Vibrating wire piezometer (VWP) converts water pressure to frequency signal via a diaphragm, a tensioned steel wire, and an electromagnetic coil. The piezometer is designed so that a change in pressure on the diaphragm causes a change in tension of the wire. There are several techniques of installation of VWPs including fully grouted method in boreholes, standard borehole or pushed by means of hydraulic rigs. The method of installation depends on the physical properties of the tailings body and the depth to which the VWPs are to be installed. We are living in the age of internet of things (IoT) and data driven decision making, and as such VWPs mitigate against many of the limitations of standpipe piezometers and ofter opportunities for realtime remote monitoring. Realtime monitoring offers a number of benefits: Conclusion At USK we provide our clients (mine tailing management companies, mines, consulting engineers (engineers of record): with professional field services for all the above methods for monitoring of pore pressure or seepage regime in mine tailings. However we strongly recommend that clients adopt the more advanced and more reliable techniques the reduce uncertainty. The cost of using high resolution characterization techniques such as CPT and realtime monitoring such as VWP allows is miniscule compared to the cost (social, environmental and financial) of tailings failure. Fore more information: Contact us at kkalule@uskconsulting.com or iwann@uskconsulting.com
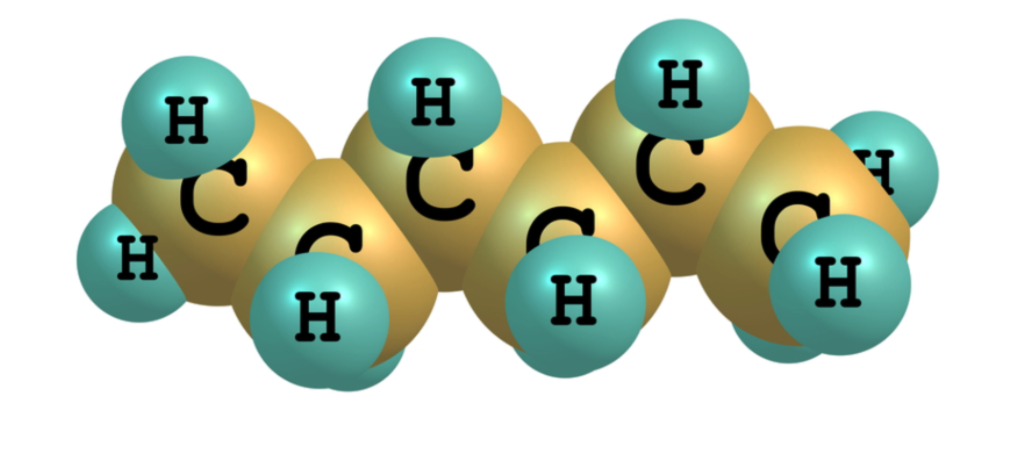
This article describes the many lessons learned from Xitech's (Now GCC Environmental) 27 years of designing systems to successfully recover Free Product during groundwater remediation projects. Free Product, which can also be called LNAPL (i.e. Light Non-Aqueous Phase Liquid), are liquids that are lighter than water, or generally petroleum hydrocarbons such as gasoline in their pure form. Dense Non-Aqueous Phase Liquids (DNAPL) are liquids that are denser than water, like coal tar or pure solvents used in cleaning products from contaminated properties. Source removal and plume containment have always been the most important cleanup objectives for these remediation sites. Free Product recovery can be a very successful cleanup approach, provided that the operator pays attention to what is going on in the extraction wells and follows a few simple well management lessons. Lesson 1: Effective LNAPL or DNAPL recovery requires that Free Product be removed intermittently. The best approach is not to exceed the recovery rate of the formation. When you exceed the recovery rate of the formation, you will form a “Water Donut” around the extraction well that stops all free product migration to the well. Taking the Free Product thickness to ZERO in an extraction well at the beginning of a project will compromise the productivity of the NAPL from the extraction well. Lesson 2: If you have an extraction well that has one foot of Free Product thickness or greater, use Xitech’s one half rule for long-term management of this well. First, let your extraction well containing Free Product rest for 24 hours. Measure the vertical product thickness in the well. Next, select a pumping time on your above ground controller that will remove onlyone half of the measured thickness. Select the number of times a day to operate the pump that will allow full recovery of the product thickness before turning on the pump. Operate the pumping systems for a few weeks. During operations, periodically (once a week) confirm that the product has returned to full thickness right before the pump is to run. If you find less than full thickness right before the pump is to run, then reduce your pumping cycles per day. Finally, once a quarter, turn off the pump for 24 hours and check the vertical thickness of product in the extraction well. Apply the 1/2 rule to this new thickness for the new quarter. Lesson 3: If you have a heavy LNAPL Free Product with a specific gravity greater than 0.86, then we suggest you install a heat source into the groundwater just one foot below the product/water interface and raise the well water temperature from 45 degrees F up to about 80 degrees F to reduce the viscosity of the Free Product. Lowering the viscosity of the heavy LNAPL has two benefits: increased LNAPL recovery and increased radius of influence. Caution: Heating above 80 degrees F can create a dissolved plume. Lesson 4: If you have a LNAPL Free Product in a tidally influenced well, then you will have to find a way to recover the Free Product at low tide because Free Product thickness is greatest at low tide. Time-based controls do not work in this situation. A state-based (i.e. low tide detection) control is best for tidally influenced wells. Lesson 5: If you have a high viscosity LNAPL or DNAPL (i.e. fluids with a specific gravity greater than 0.86), then you should use Xitech’s low resistant extraction well design to increase NAPL flow into the extraction well. Xitech’s low resistant extraction well design consists of: a well annulus material of 1/2″ washed pea gravel or 3/8″ glass bead which provides increased porosity between the well boring and the well casing amd a continuous wire wrap slotted well casing made from stainless steel not PVC with a slot width of 0.050 inch. This design will not silt up your extraction well because the removal rate of high viscosity NAPL out of an extraction well is much lower (i.e. low gallons per day), than a total fluids removal rate (i.e. gallons per minute). This design incorporates the French drain approach, except that we have a vertical trench/well instead of a horizontal trench. Lesson 6: Even though this is our last lesson, it is the most important one we have to share. Free Product recovery’s greatest liability is the proper handling of the recovered Free Product above ground. Maximum consideration should be paid to the safe transfer of Free Product from the well to the product holding tank and safe storage for the recovered Free Product. The worst meeting you will have is the reporting of a Free Product spill above ground. Here are our minimum recommendations for insuring safe operation of a Free Product system above ground: Double containment of the Free Product discharge line from the well to the inlet of the product holding tank, double wall storage tank, secondary containment of the Free Product Holding tank, and a fully redundant intrinsically safe level float switch for the primary holding tank. Fully redundant means there is a “LOW” level switch inside the primary product holding tank that sends its signal to a computer and its control valve and another “HIGH” switch inside the primary product holding tank that is hard-wired directly to an external control valve. The “HIGH” switch is a fail safe for the “LOW” switch. Both switches should cause the recovery pumps to stop operating. A third level switch should be located in a piping conduit that monitors the interstitial space between the inside primary tank and the outside secondary tank. This interstitial switch should also shut down the recovery pumps if the primary tank leaks. In addition to hardware, the operator should establish a SOP (i.e. standard operating procedure) that checks all three level switches once a month. I hope you have found our lessons helpful for your next Free Product recovery project. USK is the Africa Distributor for Xitect/GCC LNAPL and DNAPL Skimmer systems. Feel free to contact us with any questions at +27 72 2563230 / +27 72 6070309, or email us via our contacts page .
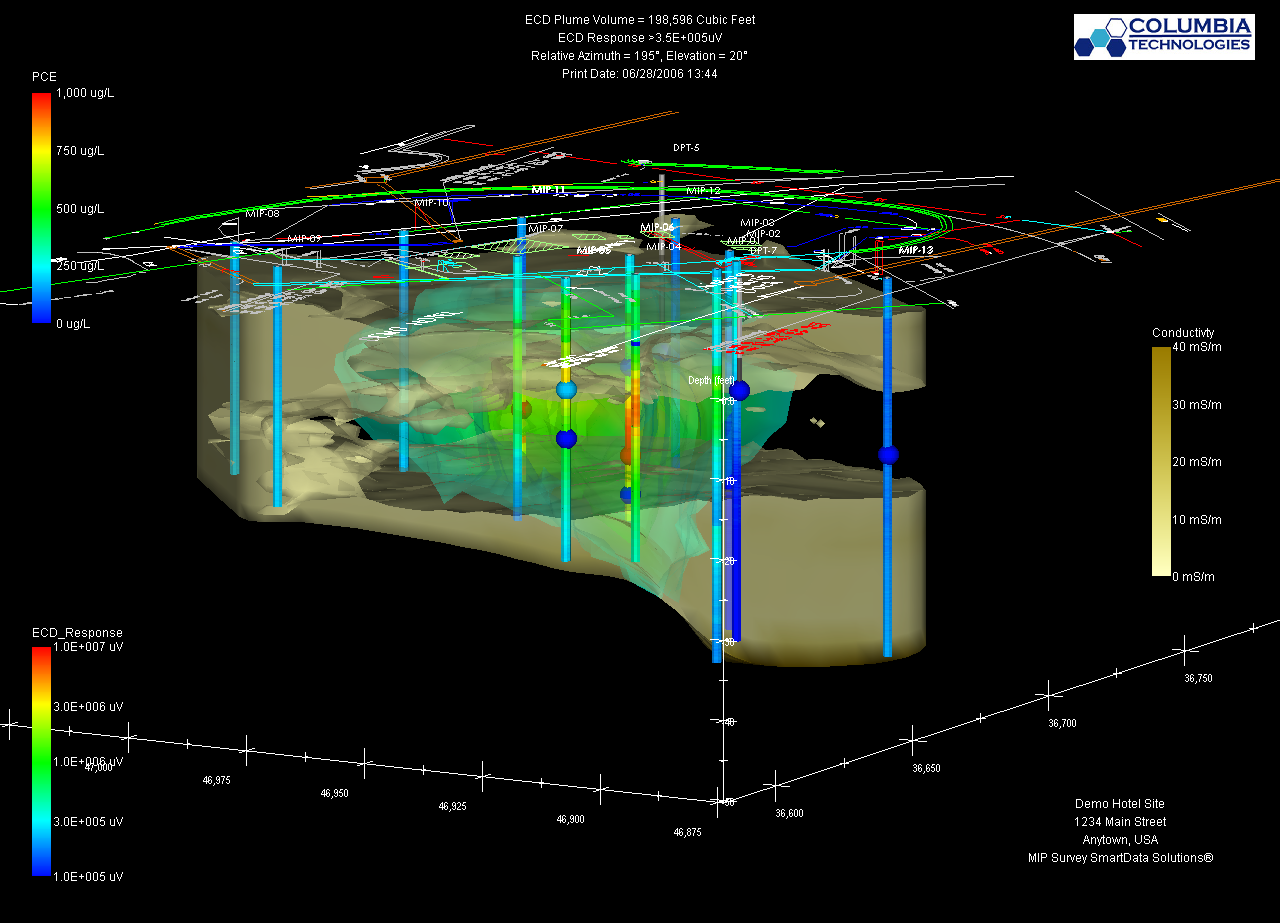
The objective of site characterization is to provide data with the least amount of uncertainty to support decisions about management of contaminated sites including remediation of a source area and/or groundwater plume. The amount of data required to support these decisions varies from site to site depending on contaminants of interest, local geology and hydrogeology. Experience has shown that cost effective and sustainable contaminated site management actions require an accurate conceptual site model (CSM). Collecting High density data is of critical importance for developing accurate CSM and enabling decision makers and key stakeholders to make right call on sustainable management of sites including successful remediation strategies. High density data collection refers to scale appropriate sampling both spatially and vertically. In order to be a cost effective approach, USK and Columbia Technologies offer efficient real-time direct sensing and imaging technologies as well as on-site analytics for groundwater, soil and gas samples enabled by our advanced drilling capabilities .
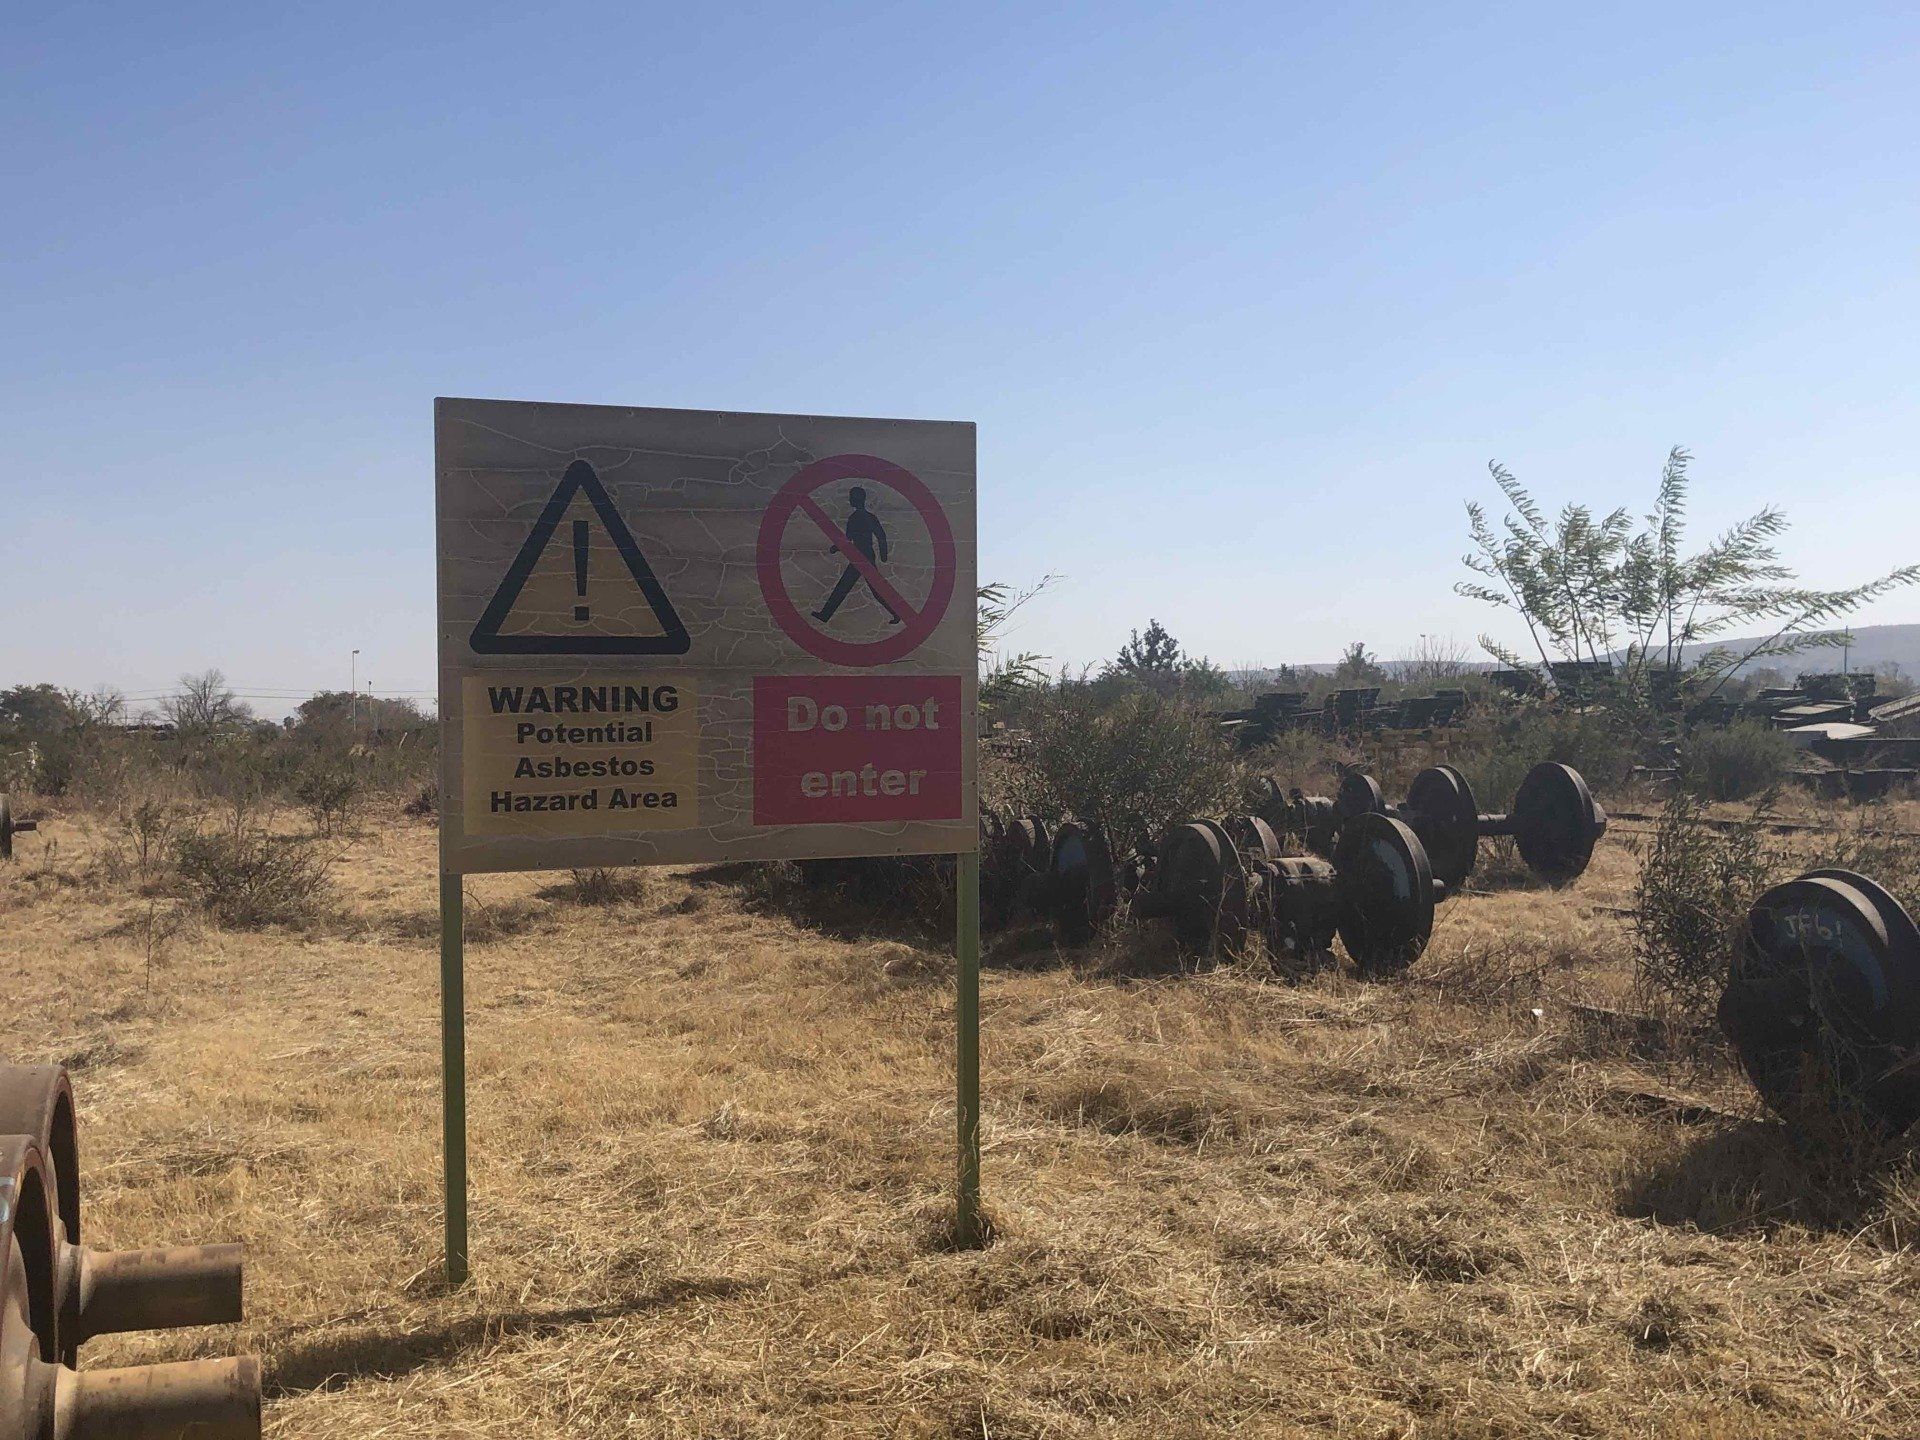
Since 2012, USK has been working with a client who is faced with a challenge of very large parcels of land that are contaminated with asbestos from historical use. It has been "a long walk to freedom" which is our banner as South Africans, but together with the client and the regulators, we sought an approach that can meet a certain agenda. This agenda is an agenda for a CIRCULAR ECONOMY . A circular economy and Sustainability There are many definitions, but in a nutshell its the cyclical nature pattern, a circular economy is presented as a system of resources utilization where reduction, reuse and recycling of elements prevails: minimize production to a bare minimum, and when it's necessary to use the product, go for the reuse of the elements that can not return to the environment. As the noble goal of sustainable development gathers scientists and engineers find themselves at the heart of the circular economy. In the past couple of years there has been a great deal of interest in the topic of sustainable remediation, and this year 2020 is so vital to drive this message home, here in Africa. The 10th annual Sustainability Week scheduled for 30 June - 02 July 2020, and incorporating the 3rd Sustainable Cities Southern Africa Conference, will facilitate a southern African multi-sector dialogue that has never been more important and timeous in light of the dire effects of climate change, widespread environmental and human health challenges, and the desperate need for employment and economic development. Further the Network for industrially contaminated land in africa (NICOLA) will also have a special focus on sustainable remediation. Today we have the opportunity to drive real change, to develop projects that have a low carbon and environmental impact in the deconstruction and remediation. The goal is to move towards a virtuous model, by recommending the sustainable management of resources, from raw materials, operation and the waste produced by decommissioning, remediation and dismantling projects. Project Decommissioning and deconstruction requires shifting from a waste-based to a resource-based vision across the entire value chain of waste flows. Recycling, reusing and recovering waste, materials, rubble and soil in an efficient way requires a more collaborative forward-planning approach between all worksite and reconversion project stakeholders. To ensure polluted soils can be reused safely, remediation must be effectively controlled and managed. A Quick Word about the Asbestos Project The project involves the remediation of approximately 22 hectares of prime urban land that is contaminated with asbestos. USK was tasked with the characterization investigation, feasibility study and design of engineering remedial measures to return this land to usable land. The remedial options that were chosen for the individual sites have been vetted through a multi-criteria decision analysis (MCDA) process, that involved various stakeholders. Finally the highest scoring options, i.e. the Best Practicable Engineering, Environmental, Social and Economic options were put forward for detailed design and authorization by the regulating authority. A remediation order has been granted and now the project is ready to be implemented. This is a landmark project in the sense that it is the single largest asbestos contaminated remedial site in South Africa, and the approach has truly been one that seeks to incorporate the ideals of a circular economy and sustainability in remediation.

The dawn of next-generation tools such as Hydraulic Profiling Tool (HPT) and its combo variants Membrane Interface Hydraulic Profiling Tool (MIHPT); and Optical Imaging Hydraulic Profiling Tool (OiHPT), have forever changed the face of contaminated site characterization and remediation. These tools take high-resolution site characterization of NAPLs in unconsolidated media to a completely new realm of possibilities. They have enabled the development of far more accurate conceptual site models (CSMs) and a realistic surgical conceptualization of aquifer architectures. Traditional or conventional methods miscomprehend the often order of magnitude effect, that stratigraphic heterogeneity and anisotropy on contaminant mass flux and storage and the net impact on project life cycle costs. It is now widely recognized that the majority of groundwater flow and contaminant mass flux occurs through the most permeable facies and that these can represent a relatively small percentage of the overall aquifer volume at most sites (less than 20%). At the same time, we know that mass storage in lower permeability facies can plague sites for decades as result of in/out diffusion. The HPT and its variants have enabled the collection high density hydrostratigraphic and hydrobiogeochemical data at the same scale and spatial resolution. This allows for more accurate understanding and visualization of the depositional environment and aquifer architecture and the role they play in the fate and transport of contaminants It is time for contaminated site professionals and remediation managers to move beyond conventional investigation methods developed decades ago and fully embrace the use smart investigation tools which are dynamic, adaptive and scale appropriate. These technologies will enable better, more cost-effective decision-making by increasing the information content and quality from the investigation efforts. Compared to the conventional linear, iterative investigation cycle using monitoring wells, this approach provides realtime, high-density data to accurately map the geology and contaminant distribution at high resolution. For more details, read some case studies https://www.itrcweb.org/DNAPL-ISC_tools-selection/Content/Appendix%20G%20Field%20Application.htm.
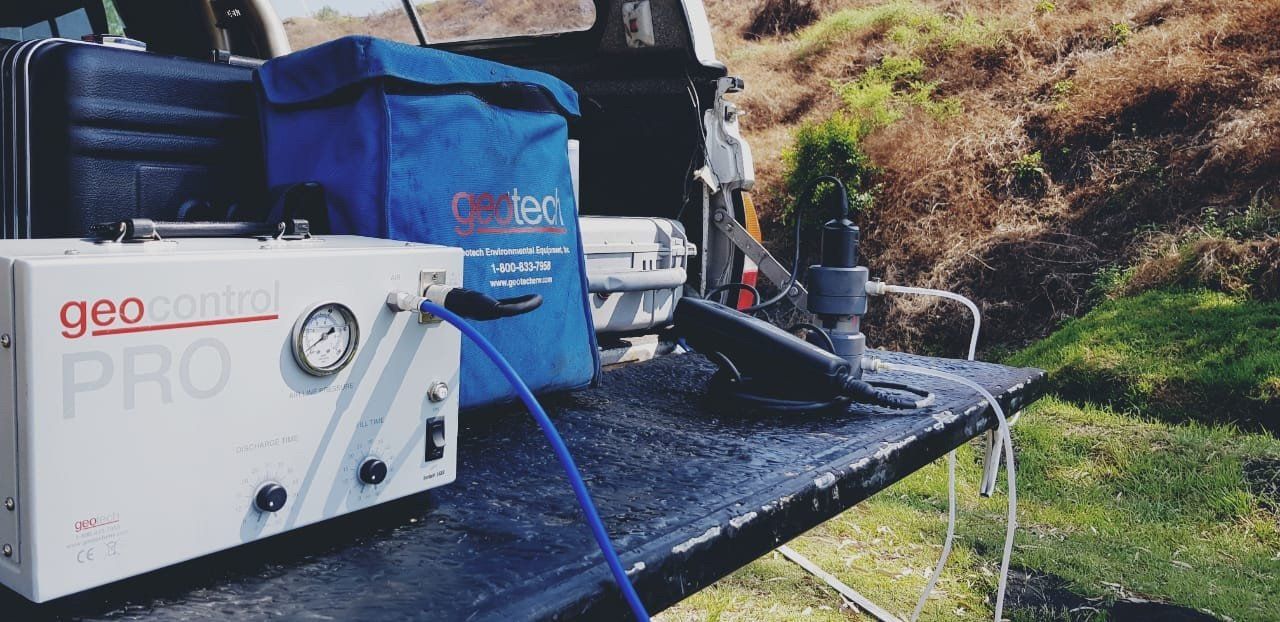
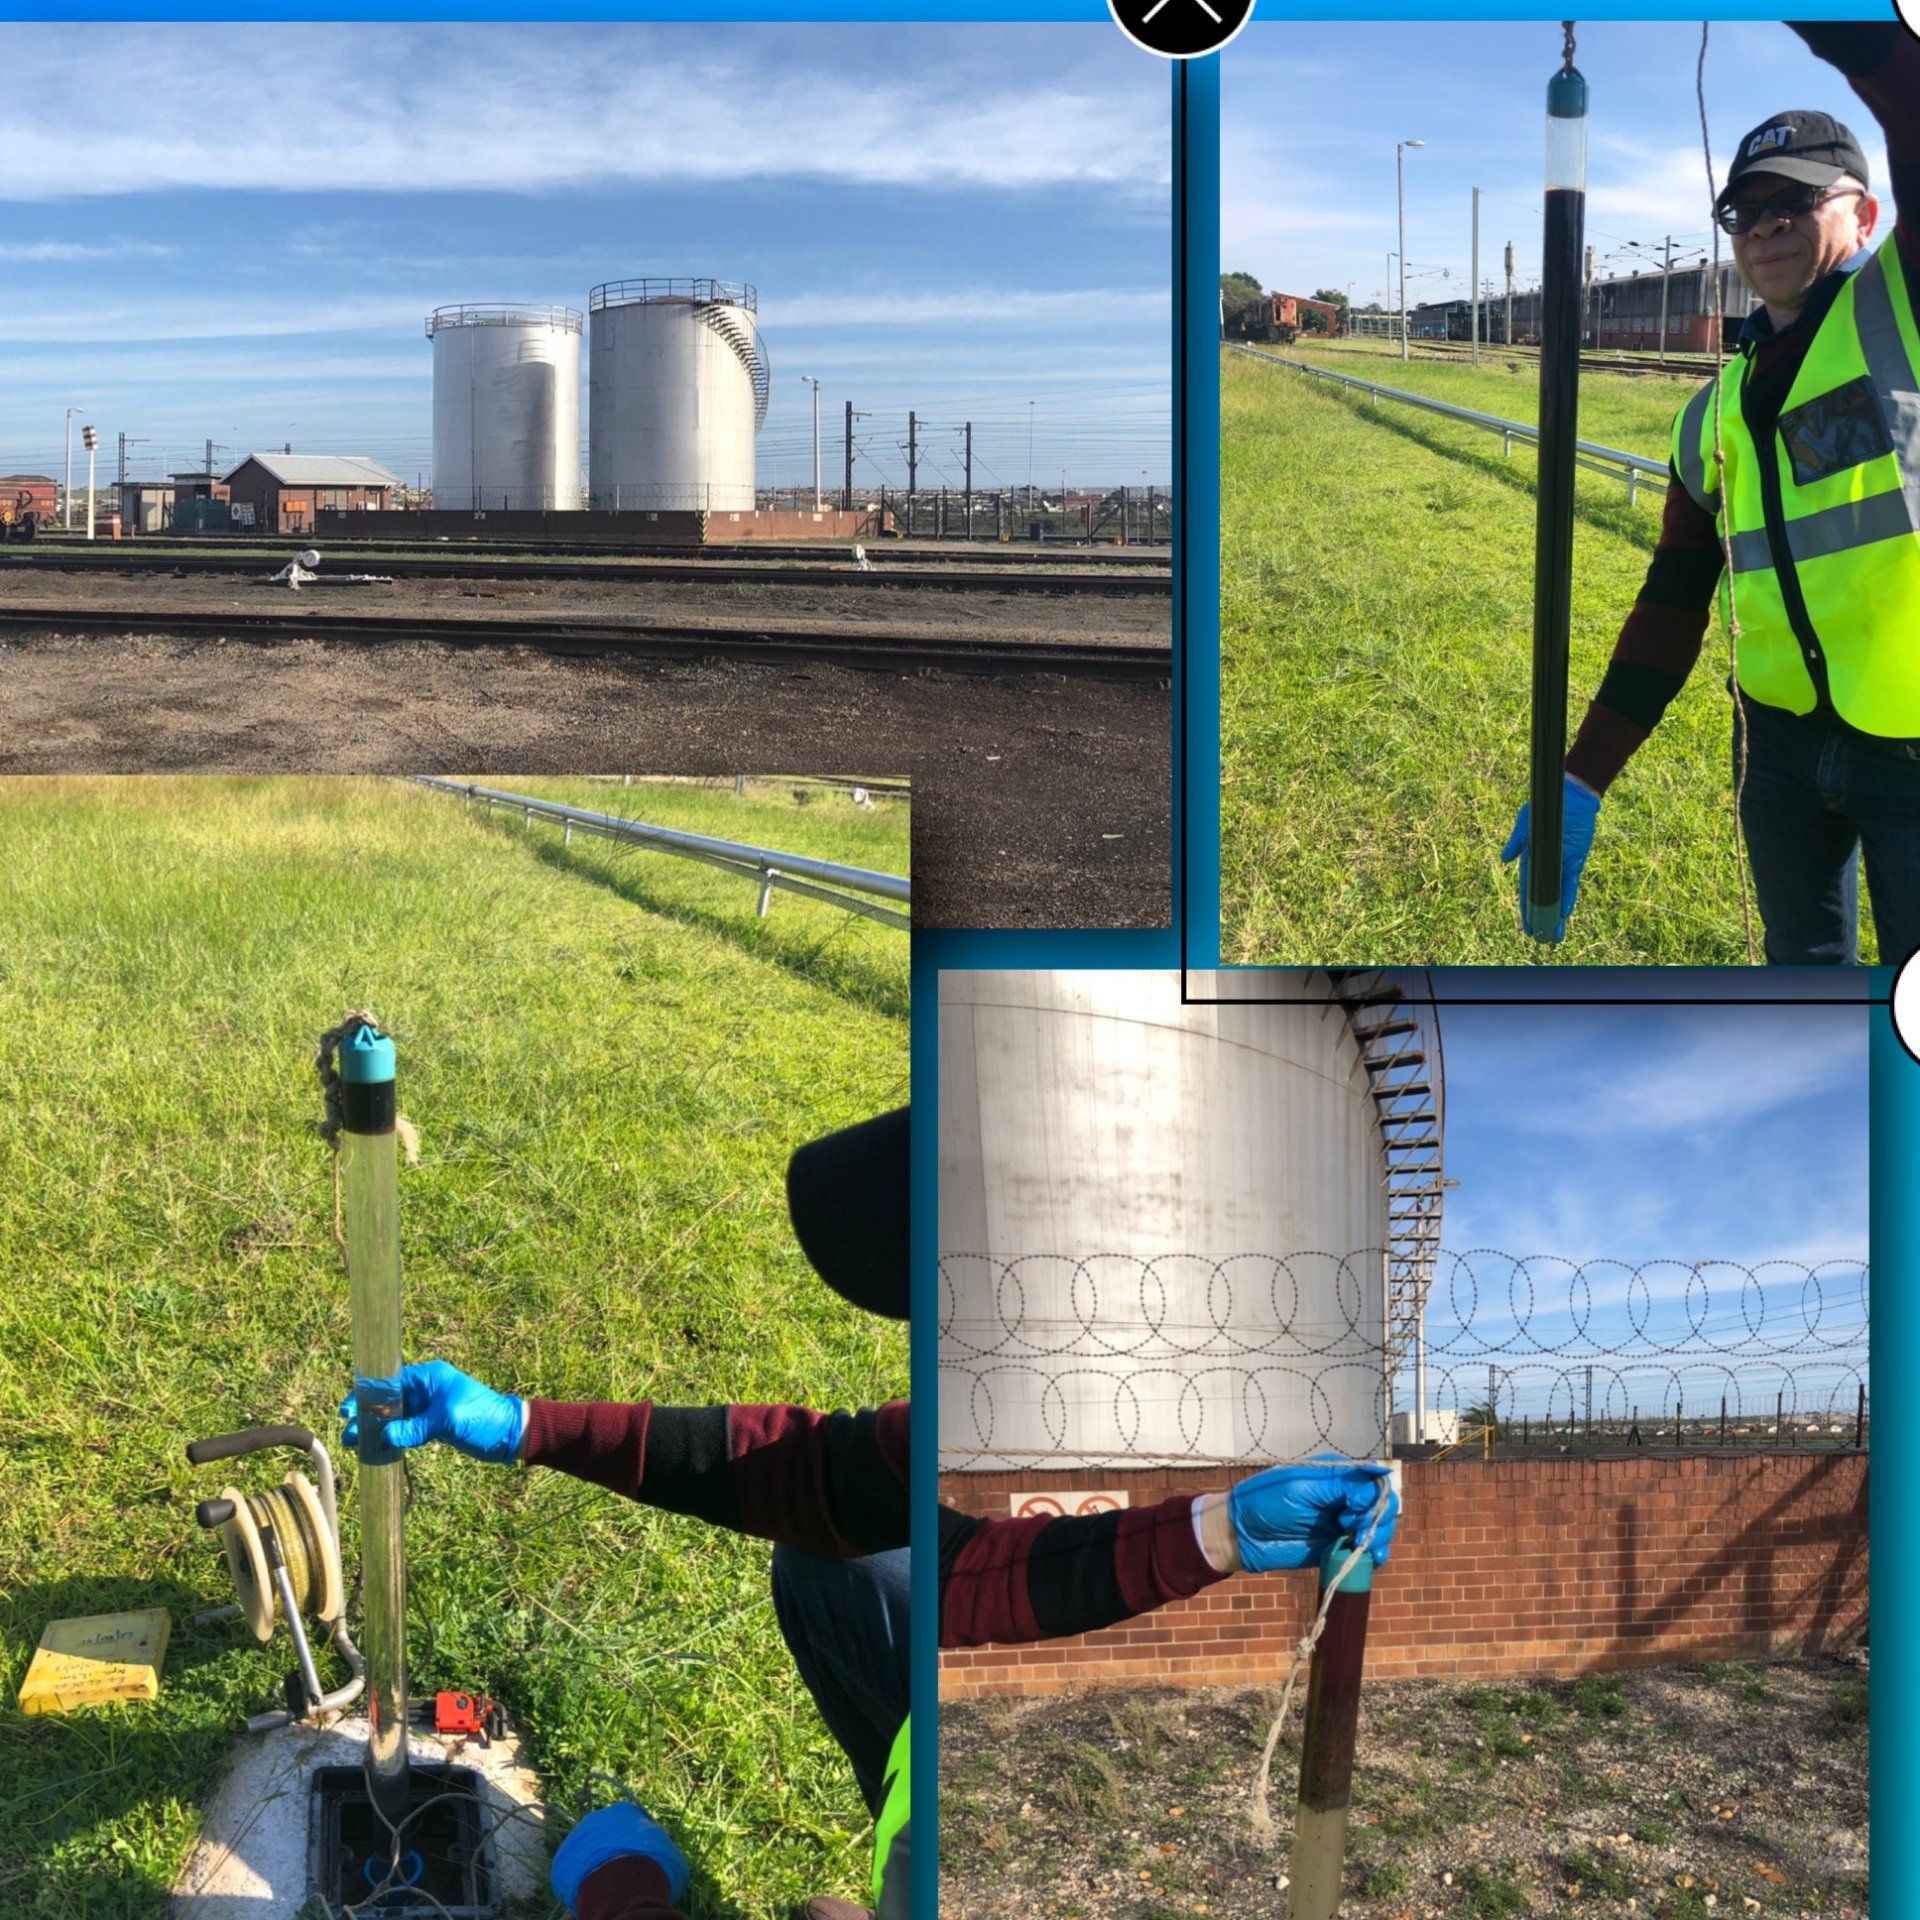
Low-flow groundwater sampling is an increasingly accepted method of collecting groundwater samples with a strict set of guidelines to ensure consistent sample representation and quality. Groundwater is extracted from the well at a very low rate (<500 mL/min) so that drawdown of the water level is minimized. Water samples from the more hydrogeologically conductive areas of the aquifer around the well screen are monitored with water quality instruments for stability to indicate the change from stagnant well water to representative formation water. After the water quality parameters stabilize, a sample of formation water can be taken with a minimal amount of geochemical disruption to the sample. Why switch to low flow sampling? Improve sample quality. Improve sample representativeness. Reduce wastewater created by large volumes of sample purging. Reduce field time by setting up sampling events with Flow-Sense software in the office. Reduce field time with automated data collection and stabilization of water quality parameters. Eliminate errors created by manual field recording and manual data transcription. Create more detailed sampling summaries, records, and reports. Save time and money with quick and easy digital report formats. Produce professional reports that can be inserted directly into your project deliverables. Provide a complete calibration history of the sampling event to ensure sample validation. Save time and money by digitally organizing sampling events. Minimum Requirements for low-flow groundwater sampling. Low-flow refers to the velocity that is imparted during pumping to the formation pore water adjacent to the well screen, not necessarily the flow rate of water discharged by the pump. Low-flow purging can be used on any well capable of being pumped at a constant rate of 1.0 L/min or less without continual drawdown of the water level in the well. A typical flow rate from a pump during low-flow purging is approximately 0.1 to 0.5 L/min. Continuous discharge pumps with variable flow rates are preferred, but Cyclic discharge is also acceptable (bladder pumps). Dedicated pumps are preferred. Grab sampling devices such as bailers, and inertial-lift devices cannot be used. Peristaltic pumps are discouraged because of loss of VOCs, degassing, and pH and oxidation reduction potential (ORP) changes. You must have a water level indicator for initial readings and drawdown monitoring with accuracy (±0.01 ft. /3 mm). Flow cells are preferred for monitoring, especially for dissolved oxygen (DO) and ORP readings, which will be altered if exposed to atmosphere. Calibration of multi-parameter equipment is required once a day, with periodic checks. The pump should be placed at the mid-point of the submerged well screen. Drawdown in any well should not exceed 0.1 m/0.33 ft./4 in. or 25% of the distance from the top of the well screen to the pump intake. Stabilization parameters: pH: ±0.2 pH units Conductivity: ±3% of reading DO: ±10% of reading or 0.2 mg/L, whichever is greater ORP: ±20 mV Turbidity: ±10% of the prior reading or ±1.0 NTU, whichever is greater (not always required) Flow cell sample rate measurement frequency should be based on the time required to completely evacuate one volume of the flow cell, associated tubing and pump volume. Stabilization is reached when three consecutive readings meet the stabilization criterion listed above when sampled at the established rate. Field reporting requirements: Equipment calibration report Site specific data (project name, site, well number, well depth, well diameter, screen length, casing type, pump type, tubing type) Initial water level Pump placement/type (relative to well screen and static water level). Final pumping rate Final stabilized drawdown Water quality measurements (date, time, temperature, pH, ORP, conductivity, DO, turbidity).
The use of high-resolution site characterization (HRSC) technologies is very useful and effective in assessing and cleaning up petroleum releases at leaking underground storage tank sites. While there are higher upfront costs with HRSC, it is now widely accepted that more accurate source area definition and LNAPL distribution obtained through HRSC enabled the development of better conceptual site models and identification of targeted treatment areas, which results in more effective, expedient, and cost-effective corrective actions. HRSC is recommended not only at new release sites, but perhaps more importantly at old release sites where conventional site characterization methods resulted in ineffective remediation efforts due to inadequate source area characterization. At many of these older sites, HRSC is now being used to re-evaluate and find residual petroleum sources and LNAPL pockets that may have been missed using conventional methods, as well as to identify targeted treatment areas to implement more effective remedies resulting in more quicker site cleanups and closure. In addition to identifying LNAPL distribution for remedial purposes, HRSC data (LIF, OIP, UVOST) in conjunction with LNAPL transmissivity test data is used to demonstrate that LNAPL recovery is not practical and the LNAPL does not pose a saturation-based risk. This has resulted in better risk-based decision making and more prudent time/fund management by preventing unnecessary expenditures on ineffective recovery efforts. There has been have a lot of success using HRSC tools such as MiHPT, a combination of two high resolution tools—the MIP (membrane interface probe) and the HPT (hydraulic profile tool)—to better characterize heterogeneity of hydraulic conductivity and to identify mass storage and high flux zones, which results in better remedial designs and more effective and timely corrective actions. The cost of HRSC LNAPL Assessment ranges from $25,000 to $40,000 for typical Fuel Retail Stations depending on the complexity of the site. However, the effectiveness of any cleanup is contingent on the thoroughness of the site characterization. Embarking on LNAPL cleanups can cost several hundred thousand dollars, so without spending a fraction of that upfront on a thorough assessment is being pennywise and pound-foolish.